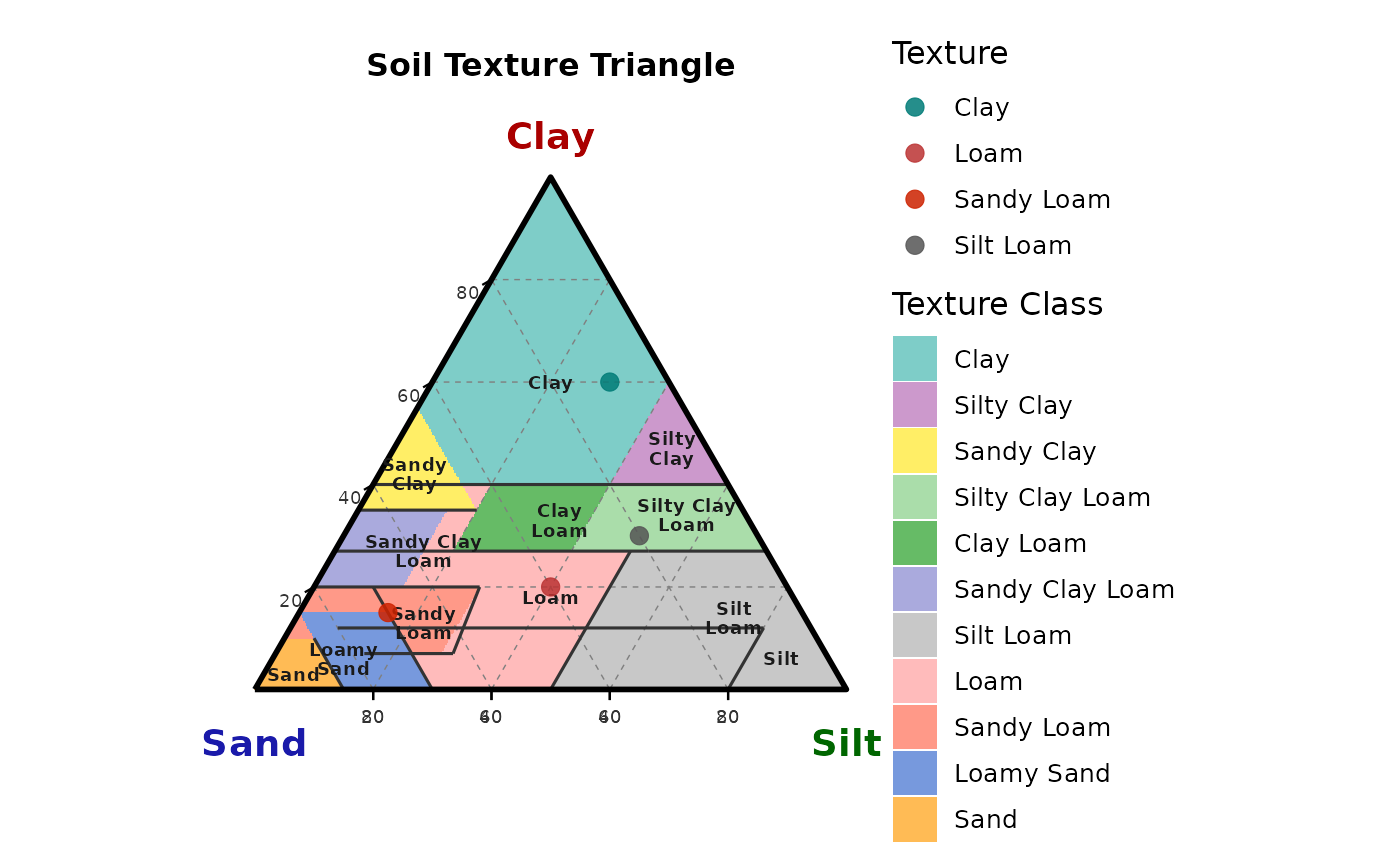
Creates a USDA texture triangle with filled texture-class regions,
USDA class boundary lines, class name labels, and optional data points —
all using a pure ggplot2 ternary-to-Cartesian projection (Clay at top,
Sand at bottom-left, Silt at bottom-right). No external ternary-plot
package is required.
Usage
texture_triangle(
  df,
  sand_col = "sand_total",
  silt_col = "silt",
  clay_col = "clay",
  color_col = NULL,
  title = "Soil Texture Triangle",
  point_size = 3,
  alpha = 0.85
)
Arguments
- df
A data frame.
- sand_col
Column name for sand (default
"sand_total").- silt_col
Column name for silt (default
"silt"). Used only for data point projection; silt for the background grid is derived as100 - clay - sand.- clay_col
Column name for clay (default
"clay").- color_col
Column name for colouring data points (default
NULL— points are drawn in black). If the column contains USDA texture class names the same USDA palette is applied automatically.- title
Plot title.
- point_size
Point size (default
3.0).- alpha
Point transparency (default
0.85).
Details
The background is always coloured by USDA texture class (12-class
USDA-inspired palette). Data points are overlaid and can be mapped to a
separate variable via color_col.
Examples
df <- data.frame(sand_total = c(70, 20, 10, 40),
                 silt       = c(15, 50, 30, 40),
                 clay       = c(15, 30, 60, 20),
                 Texture    = c("Sandy Loam", "Silt Loam", "Clay", "Loam"))
texture_triangle(df, color_col = "Texture")